Table of Contents
Yesterday we examined East Texas water rights disputes between rural landowners and municipal authorities. Today’s data reveals what cities are actually doing with that water—and why understanding Texas metro water sources matters for land development decisions across the state’s four largest regions.
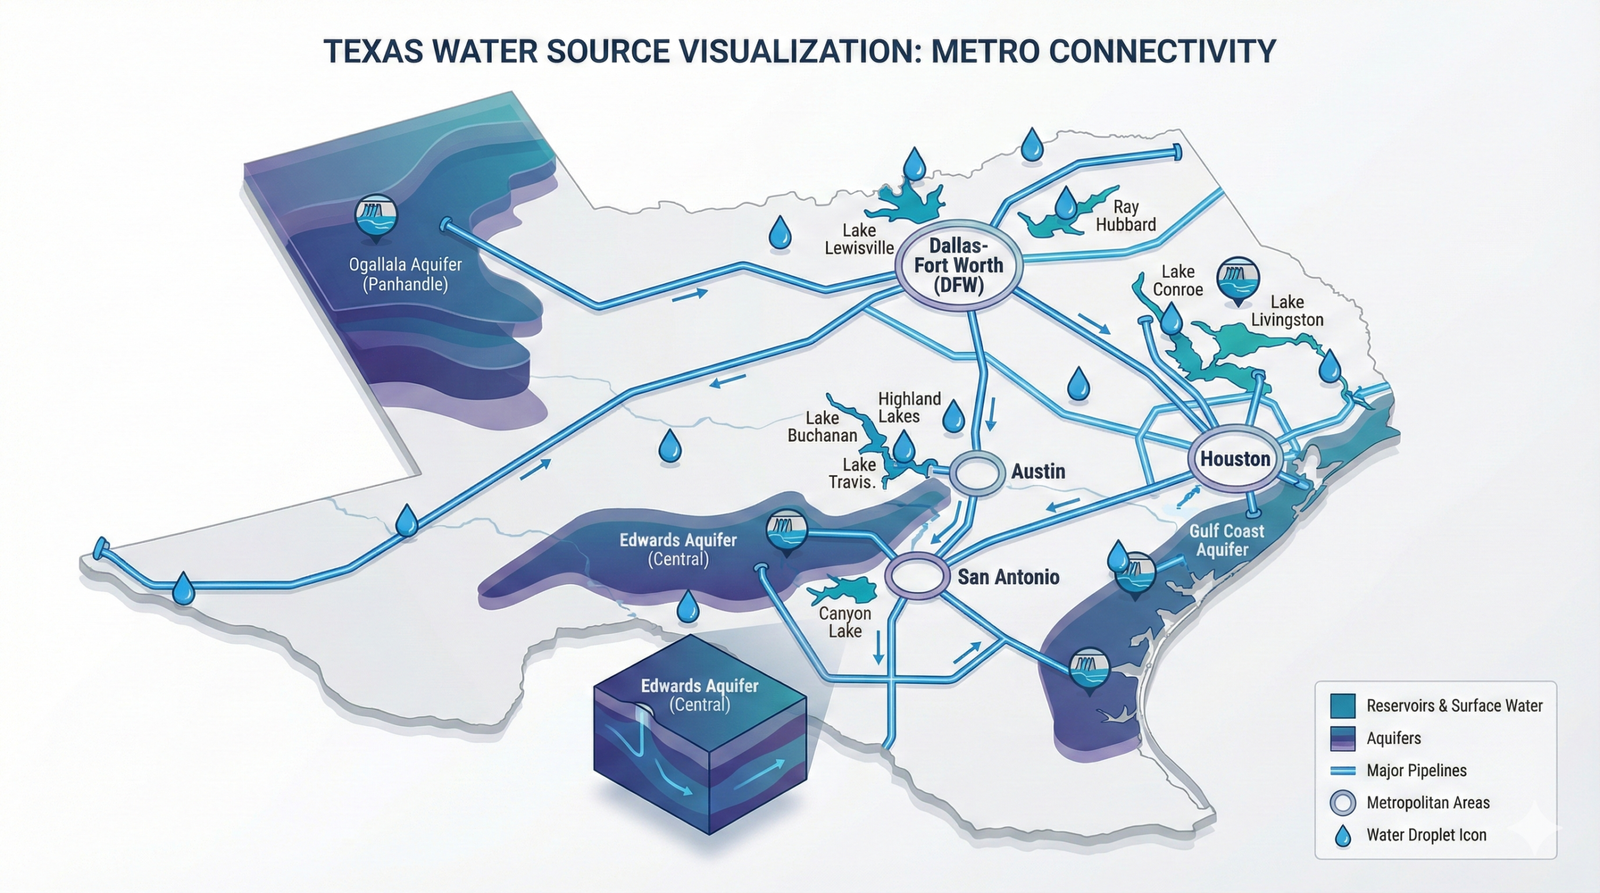
Texas A&M’s Real Estate Research Center just mapped water consumption and Texas metro water sources across DFW, Houston, San Antonio, and Austin, breaking down industrial versus residential use and critically where each region sources its supply. The findings show dramatic differences in how these metros secure water, with direct implications for infrastructure capacity and development risk.
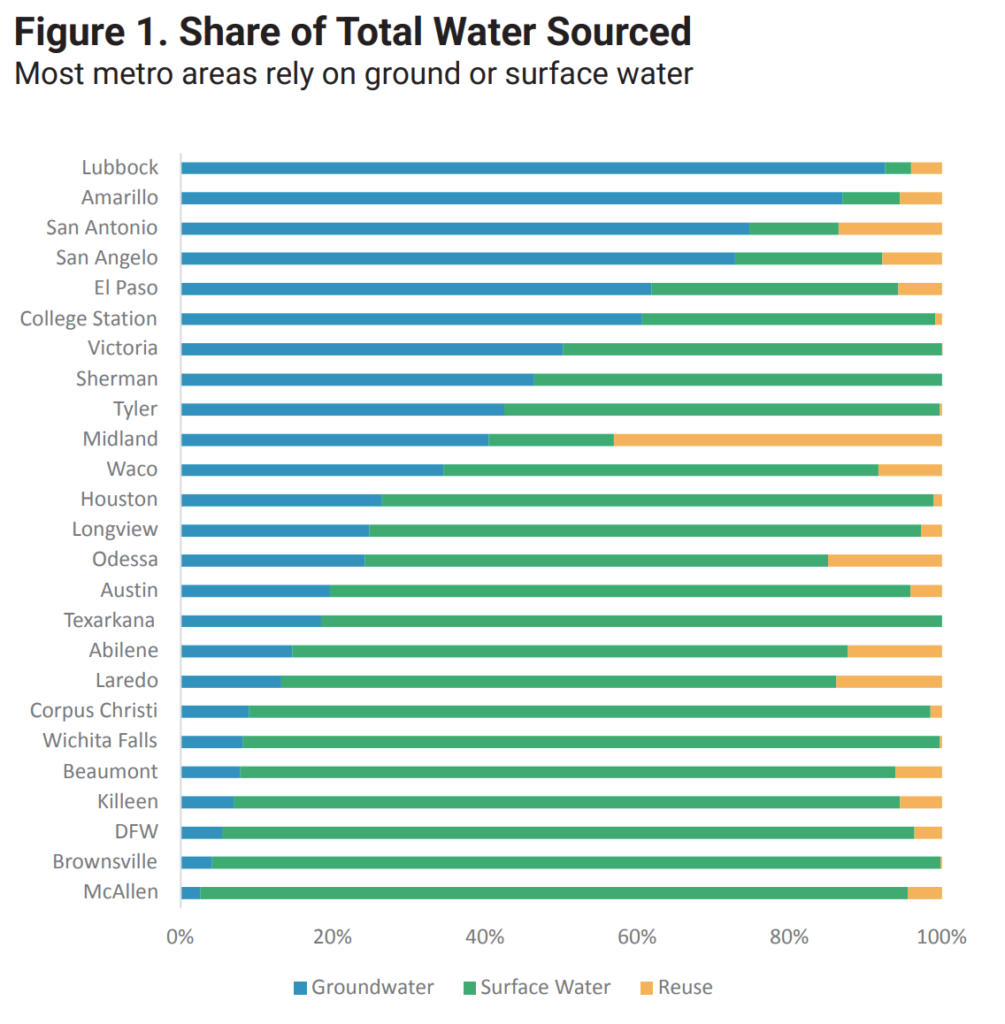
The Source Mix: Surface Water Dominates, But Not Everywhere
Dallas-Fort Worth pulls 91% of its water from surface sources, with only 8% from groundwater and 1% from reuse. That heavy reliance on reservoirs like Lewisville, Grapevine, and Ray Roberts creates vulnerability during drought cycles but also explains the intense focus on reservoir expansions and East Texas pipeline projects like the $2.3 billion Integrated Pipeline connecting Lake Palestine to existing DFW infrastructure.
Houston shows similar surface dependence at 86%, drawing from Lake Houston, Lake Conroe, and Lake Livingston. Groundwater contributes 11%, but the region’s subsidence issues make further aquifer extraction problematic. Reuse sits at just 3% low given the city’s industrial water demands.
San Antonio flips the script entirely, sourcing 56% from groundwater, primarily the Edwards Aquifer, with 44% from surface water. No other major Texas metro leans this heavily on aquifers, making San Antonio uniquely exposed to Edwards Aquifer Authority regulations and recharge zone restrictions.
Austin takes the middle path: 85% surface water mostly from the Colorado River via Lakes Travis and Buchanan, 9% groundwater, and 6% reuse. That 6% reuse figure, double Houston’s, reflects Austin Water’s deliberate push toward reclaimed water for industrial and irrigation customers.
Industrial Demand: The Hidden Infrastructure Load
Residential water use gets the headlines during droughts, but industrial consumption drives infrastructure planning across Texas metro water sources.
DFW’s industrial sector consumes 134,000 acre-feet annually compared to 524,000 acre-feet residential. That 1:4 ratio means industrial users represent roughly 20% of total demand enough to shape where treatment plants get built and pipeline capacity gets allocated.
Houston’s industrial footprint is far heavier, with 171,000 acre-feet industrial against 405,000 residential. That’s a 1:2.4 ratio industrial demand accounts for nearly 30% of the total load, driven by the petrochemical corridor and port operations.
San Antonio shows the lowest industrial intensity at 47,000 acre-feet industrial versus 193,000 residential (1:4 ratio, similar to DFW). The military presence and JBSA installations contribute to municipal demand, but the city lacks Houston’s heavy manufacturing base.
Austin sits at 64,000 acre-feet industrial and 138,000 residential, a 1:2.2 ratio that reflects the tech sector’s data center growth and Samsung’s fabrication expansion east of the city.
What Regional Water Sources Mean for Land Development
Understanding Texas metro water sources is critical for site selection and development feasibility. Each region’s strategy creates distinct opportunities and constraints.
In DFW, any project requiring substantial water allocation faces scrutiny on reservoir capacity and pipeline access. The 91% surface water dependence means development east or north of the metro, near reservoir systems, has clearer paths to service than western Tarrant County projects that strain existing infrastructure. The recently operational Integrated Pipeline Project adds 350 million gallons per day capacity from East Texas reservoirs, improving long-term supply but also intensifying the decades-long debate over the proposed Marvin Nichols Reservoir on the Sulphur River.
In Houston, subsidence concerns limit groundwater options, pushing new industrial development toward areas already served by surface water treatment plants or forcing developers to negotiate reuse agreements. The 30% industrial load means competition for capacity, especially in energy corridor zones where petrochemical operations already dominate allocation.
In San Antonio, Edwards Aquifer recharge zone restrictions eliminate groundwater options for many projects. Development over the recharge zone faces additional permitting hurdles and impervious cover limits. Surface water from Canyon Lake and the Carrizo-Wilcox Aquifer offers alternatives, but infrastructure to deliver it remains concentrated in northern Bexar County. Southern and western expansion areas face tighter constraints.
In Austin, the Colorado River dependency creates upstream risk Travis and Buchanan lake levels directly impact allocation. The city’s 6% reuse rate signals opportunity: projects that can integrate reclaimed water for landscaping, cooling, or industrial process use gain competitive advantage in permitting. Samsung’s Taylor facility leveraged commitments to explore treated wastewater reuse and develop emergency water interconnects to secure water rights; future industrial projects should model that approach.
Monitoring Regional Water Strategies
Each metro’s source mix reflects decades of infrastructure investment and geological reality. Those patterns don’t shift quickly, but they do shift particularly as climate variability, population growth, and industrial expansion stress existing systems.
DFW’s next major decision point: Whether to accelerate East Texas reservoir projects or invest in reuse infrastructure to reduce surface water dependence. Land along proposed pipeline corridors gains value; parcels requiring new water line extensions face higher development costs.
Houston’s constraint: Subsidence limits and coastal vulnerability push the region toward greater reuse and conservation mandates. Industrial land with existing water rights or treatment plant proximity becomes premium. Greenfield sites without infrastructure face longer timelines.
San Antonio’s bottleneck: Edwards Aquifer politics and recharge zone restrictions force development north and east toward Guadalupe County, where Carrizo-Wilcox access improves. Bexar County land outside the recharge zone but inside existing service areas holds value; recharge zone parcels face permanent limitations.
Austin’s variable: Lake Travis and Lake Buchanan levels. When combined storage drops below certain thresholds, the Lower Colorado River Authority implements drought restrictions that ripple through development approvals. Sites with reuse infrastructure or Carrizo-Wilcox access decouple from reservoir risk.
The metros competing for the same population growth and industrial relocations are not competing with the same water resources. That asymmetry in Texas metro water sources creates regional advantages and constraints that show up in infrastructure timelines, permitting costs, and long-term development feasibility.
Frequently Asked Questions About Texas Metro Water Sources
Q: Which Texas metro has the most diverse water supply?
San Antonio shows the most balanced mix among Texas metro water sources, drawing roughly equal amounts from groundwater (56%) and surface water (44%). However, this also creates unique regulatory challenges given Edwards Aquifer restrictions.
Q: Why does Houston use so little groundwater despite having aquifers?
Groundwater extraction in Houston causes land subsidence the ground literally sinks as water is pumped out. This has created flooding problems and infrastructure damage, leading to strict limits on groundwater use enforced by the Harris-Galveston Subsidence District.
Q: How does industrial water use affect residential development?
Industrial users compete for the same water allocation and treatment capacity. In metros like Houston where industrial demand accounts for 30% of total use, new residential developments may face delays or higher connection fees in areas where industrial operations have already claimed available capacity.
Q: What is water reuse and why does it matter for Texas metros?
Water reuse (or reclaimed water) involves treating wastewater to standards suitable for irrigation, cooling systems, or industrial processes. It’s considered “drought-proof” because it doesn’t depend on rainfall. Austin’s 6% reuse rate versus Houston’s 3% gives Austin more flexibility during droughts.
Q: Can developers access multiple water sources for a single project?
Yes, but it requires coordination across multiple providers and higher infrastructure costs. For example, a project might use municipal water for potable needs while securing reclaimed water separately for landscaping, requiring dual distribution systems.
Q: How do Edwards Aquifer recharge zone restrictions work in San Antonio?
The recharge zone is where rainfall enters the Edwards Aquifer through fractures and sinkholes. Development over this zone faces impervious cover limits (usually 15-20%) and additional environmental review to prevent groundwater contamination. This effectively caps density for many San Antonio-area projects.
Dive Deeper Into Texas Metro Water Sources Data
The regional differences in Texas metro water sources revealed in this analysis come from Texas A&M’s Real Estate Research Center comprehensive mapping study. Their research breaks down not just where water comes from, but how different customer classes—residential, commercial, industrial, and institutional consume it across each metropolitan area.
For land professionals evaluating Texas metro water sources for development feasibility, the full study provides granular data including:
- Month-by-month consumption patterns that reveal seasonal stress on infrastructure
- County-level breakdowns showing which specific areas within each metro face the tightest constraints
- Historical trends in source diversification and reuse adoption rates
- Projections for how industrial growth will reshape demand in each region
Understanding Texas metro water sources at this level of detail helps identify which submarkets within DFW, Houston, San Antonio, and Austin offer the clearest path to water service—and which will require costly infrastructure investments or extended permitting timelines.
Access the complete study: Mapping Metro Water Use: Sources, Industries, and Consumption from Texas A&M Real Estate Research Center.